QuickPlanX 6.1: Clearer Weeks, Months, and Working Weekends in Day View
Day View in the Gantt chart gives you precise, day-by-day scheduling. QuickPlanX 6.1 introduces two new display settings for this view, addressing two distinct planning needs: bolder week and month division lines, and shaded backgrounds for weekends configured as working days.
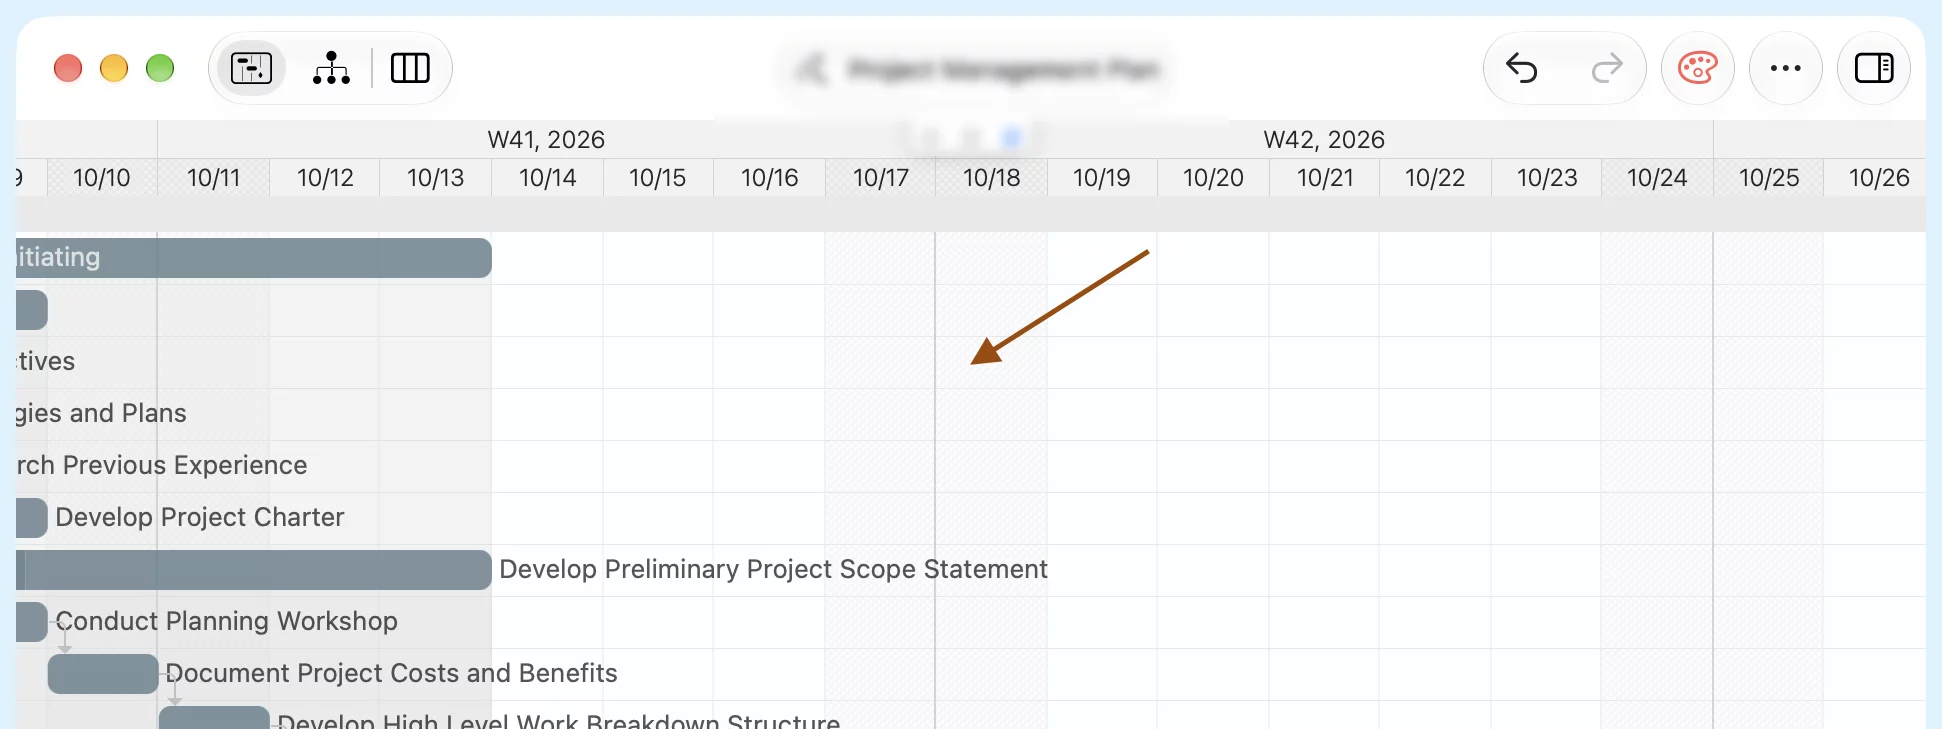
Video Walkthrough
Watch this quick tutorial to see the new grid display options in action:
Key Updates at a Glance
1. Week & Month Boundaries
On long-running projects, uniform daily lines can make it hard to spot weekly cycles. The new boundary setting adds visual anchors directly on the chart:
- Normal — Uniform, light vertical lines between all days.
- Bold — Darker, thicker divider lines marking the start of each week and month.
2. Shaded Working Weekends
When projects operate on a 7-day schedule with weekends set as working days, weekend shifts often involve special considerations (such as site access, noise rules, and overtime tracking):
- Same — Uniform background across all days.
- Shaded — Tints Saturday and Sunday columns so calendar weekends stand out immediately on the timeline.
Weekend cell shading is purely a visual aid. It does not alter working-day status, task durations, calendar constraints, or critical path calculations.
Where to find them
Both options live in App Settings → User Interface, under the Grid Lines in Gantt View section (you can also search for the Gantt or Graphics tags):
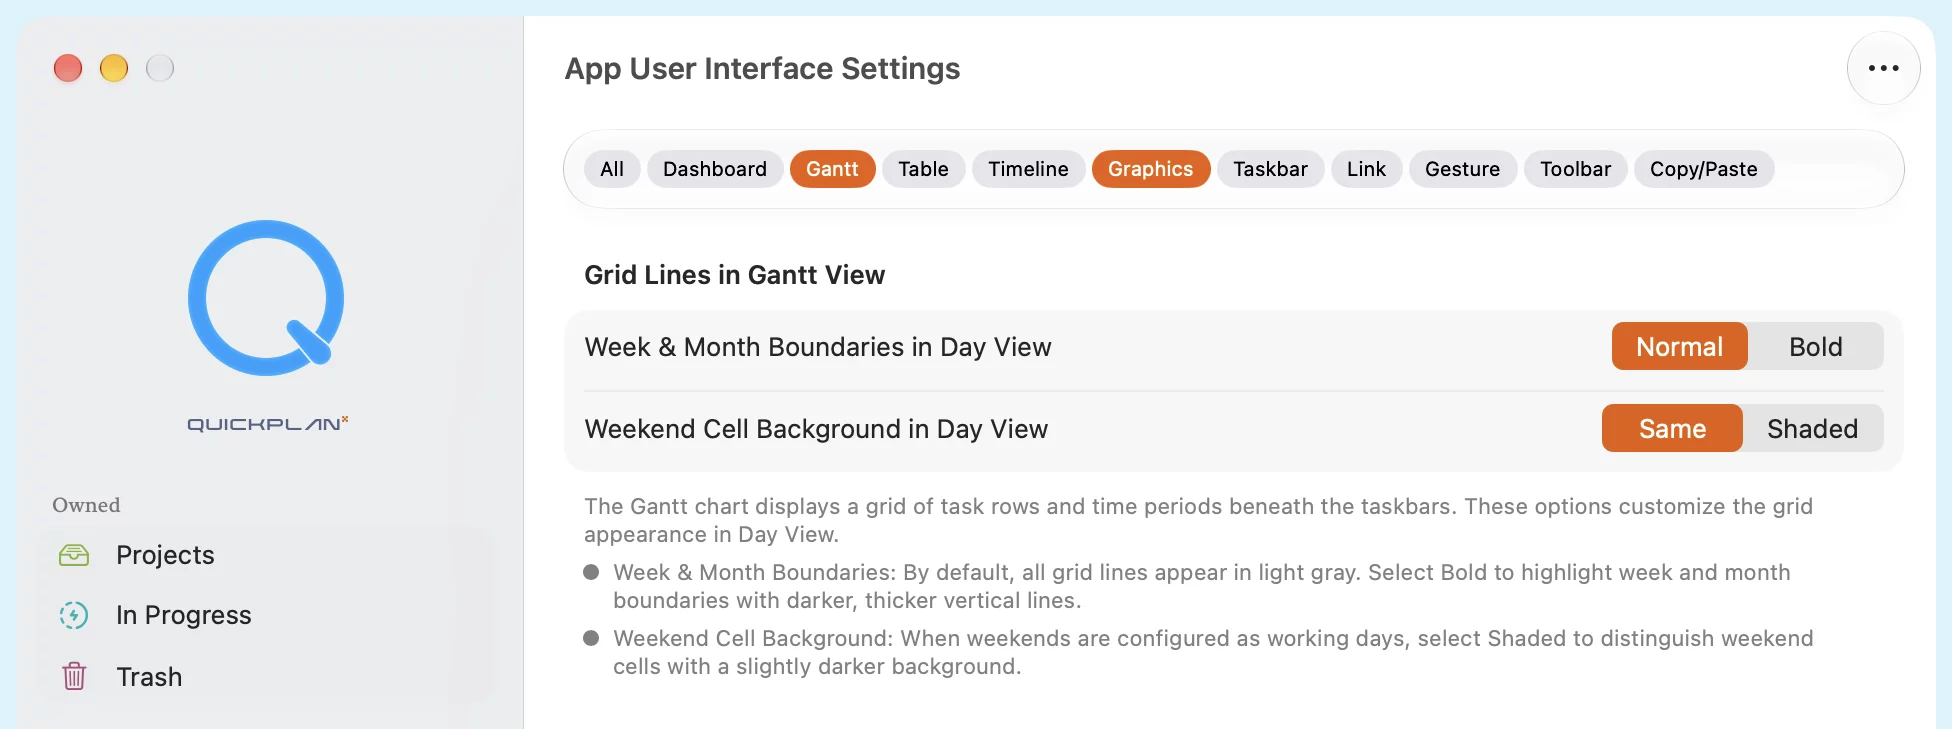
Changes apply live to the Gantt chart in the background, so you can toggle between styles and see which combination fits your project best.
For step-by-step instructions and practical tips on configuring these display options, see the Gantt Grid Lines Guide.